
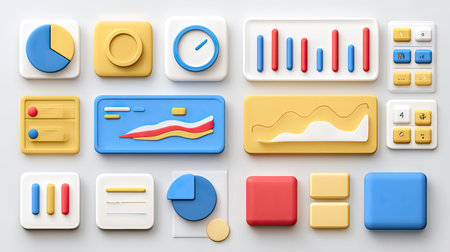
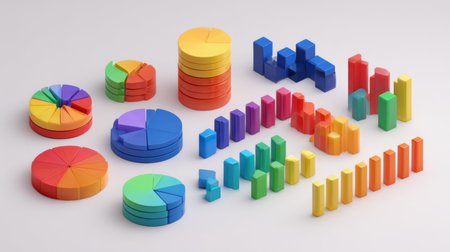
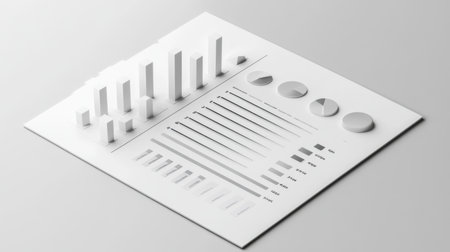
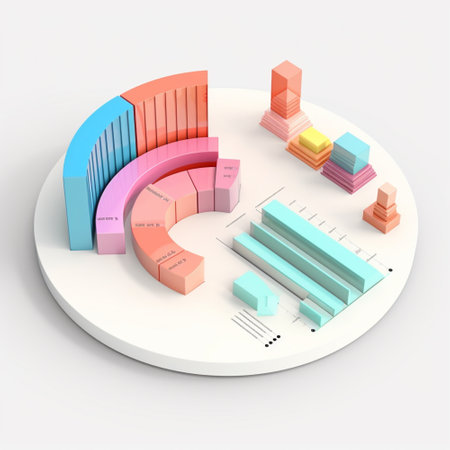
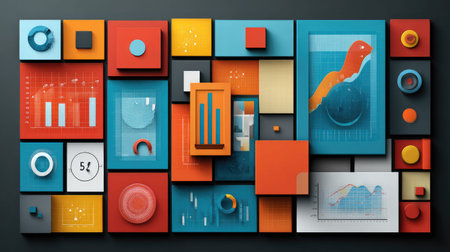
This image features a vibrant assortment of 3D shapes and colorful data visualization elements, ideal for enhancing reports and presentations.
Коллекция по умолчанию
Коллекция по умолчанию
Создать новую
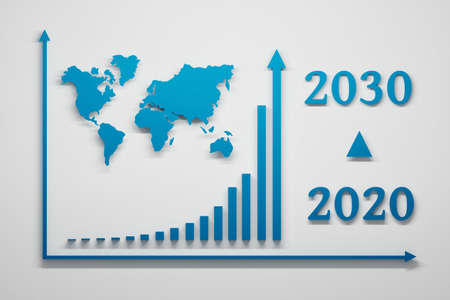
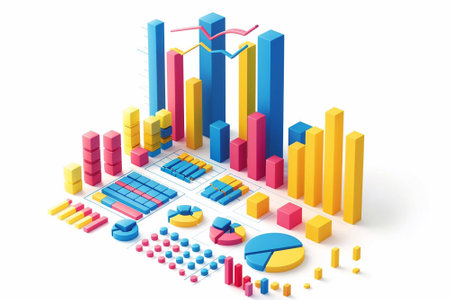
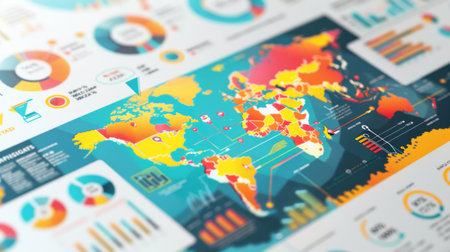
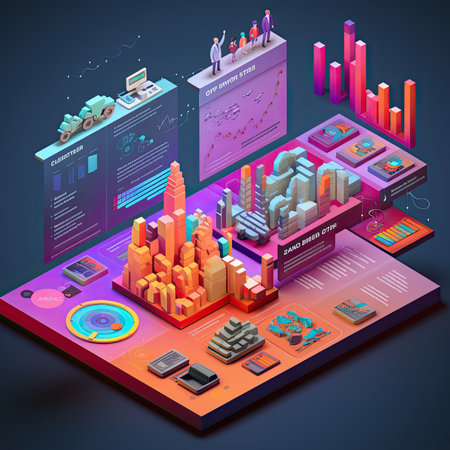
Future trend presented with exponential growth chart diagram, world map and year 2020 to 2030 numbers in blue color on white background. 3d illustration.
Коллекция по умолчанию
Коллекция по умолчанию
Создать новую
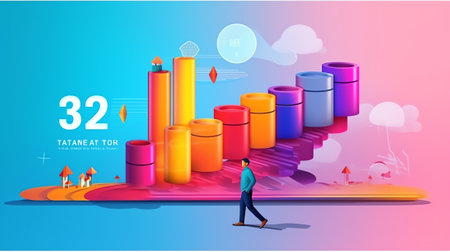
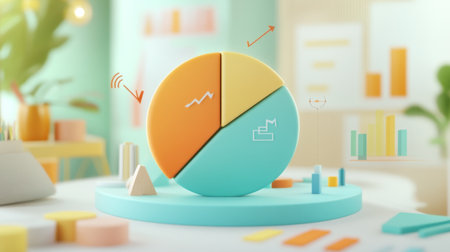
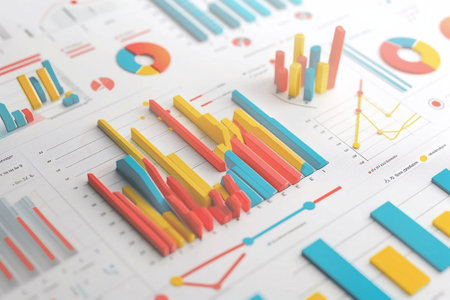
A modern, minimalist data visualization concept featuring blue elements such as graphs, clouds, and floral designs perfect for creative projects and business presentations.
Коллекция по умолчанию
Коллекция по умолчанию
Создать новую
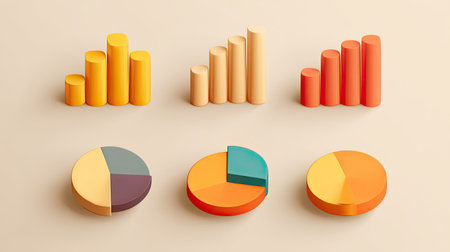
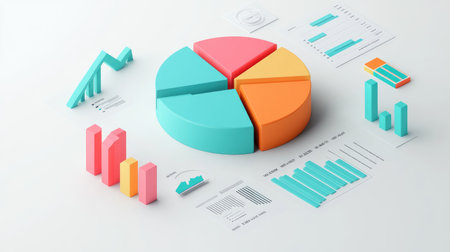
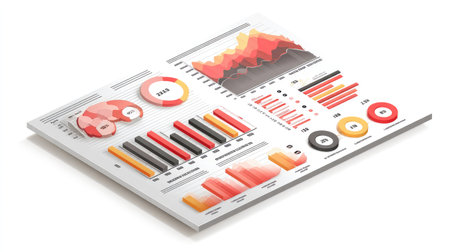
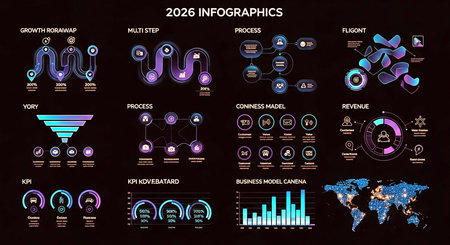
An infographic poster presenting statistical data in visually appealing graphs and illustrations for easy understanding.
Коллекция по умолчанию
Коллекция по умолчанию
Создать новую
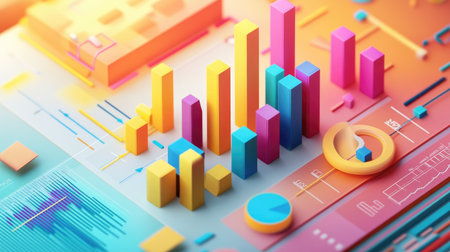
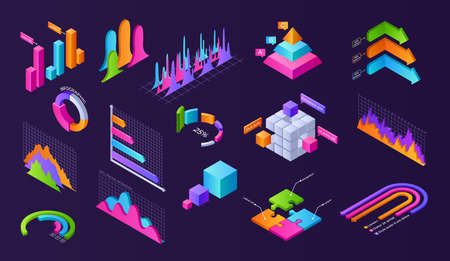
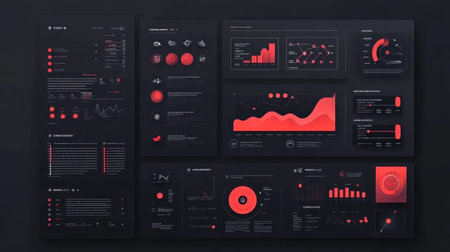
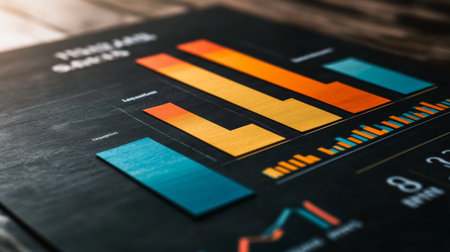
A vibrant collection of data visualization elements including colorful charts and graphs arranged on a dark surface, ideal for business analysis and presentation needs.
Коллекция по умолчанию
Коллекция по умолчанию
Создать новую
Business analytics in 3D volumetric figures. The concept of business reports.
Коллекция по умолчанию
Коллекция по умолчанию
Создать новую

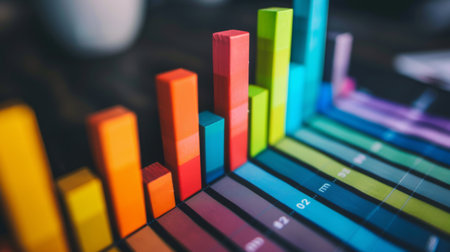
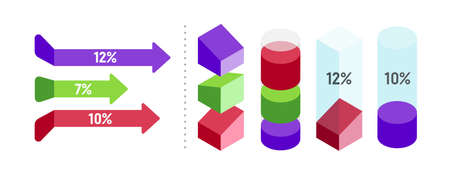
An infographic-style image displaying a vibrant D bar chart alongside various data points, with arrows and percentages, illustrating the impact of marketing strategies on company growth.
Коллекция по умолчанию
Коллекция по умолчанию
Создать новую

A vibrant stacked bar chart displaying diverse financial data in bright colors, positioned on a light background with clear labels for easy interpretation
Коллекция по умолчанию
Коллекция по умолчанию
Создать новую
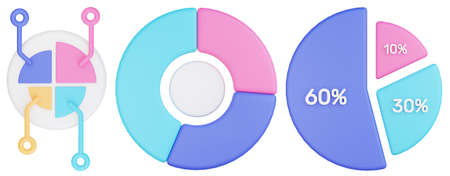
Exploded D pie chart with each segment hovering separately, surrounded by digital data icons
Коллекция по умолчанию
Коллекция по умолчанию
Создать новую
Business data elements bar pie charts diagrams and graphs. 3d rendering
Коллекция по умолчанию
Коллекция по умолчанию
Создать новую
Vibrant geometric shapes and charts ideal for illustrating data analysis concepts. Suitable for business presentations, educational materials, and creative projects.
Коллекция по умолчанию
Коллекция по умолчанию
Создать новую
Vibrant 3D pie chart with gradient of pink and orange colors, showcasing data visualization. chart is set against dark background, enhancing its modern and sleek appearance
Коллекция по умолчанию
Коллекция по умолчанию
Создать новую
A creative arrangement of 3D charts and graphs showcasing various data visualization elements, perfect for business, finance, and marketing presentations.
Коллекция по умолчанию
Коллекция по умолчанию
Создать новую

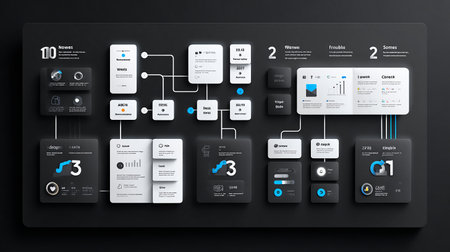
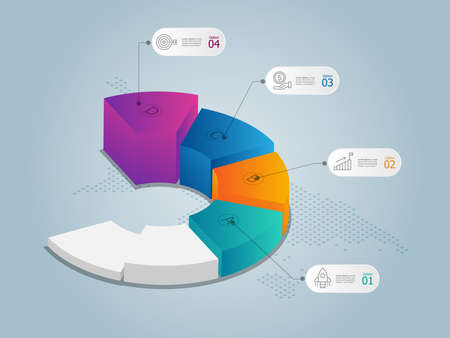
A 3D render illustrating a business strategy process with stages like planning, ideation, strategy, scheduling, and launch, featuring icons and a...
Коллекция по умолчанию
Коллекция по умолчанию
Создать новую
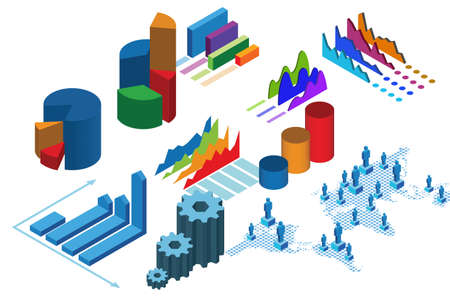
3d isometric illustration of business infographics elements, charts and diagrams
Коллекция по умолчанию
Коллекция по умолчанию
Создать новую
An image showcases an abstract chart composed of blue and white bars, likely representing data. The background is a blurred map with soft lighting, suggesting a global context. The composition emphasizes a modern, digital aesthetic, suitable for presentations or marketing materials. It could be used in business, finance or data analysis contexts.
Коллекция по умолчанию
Коллекция по умолчанию
Создать новую
3d isometric business infographics with icons and charts on dark background
Коллекция по умолчанию
Коллекция по умолчанию
Создать новую
This vibrant 3D composition features colorful graphs and charts alongside books, encapsulating modern data visualization concepts ideal for business analysis and growth.
Коллекция по умолчанию
Коллекция по умолчанию
Создать новую

A vibrant 3D globe centered in a dynamic business environment featuring colorful charts and graphs, representing globalization and data insights.
Коллекция по умолчанию
Коллекция по умолчанию
Создать новую

Close-up Of Two Different Colorful Charts On Laptop Keypad
Коллекция по умолчанию
Коллекция по умолчанию
Создать новую
This abstract business composition showcases colorful geometric shapes, charts, and plant elements, creating a modern workspace aesthetic perfect for creative projects.
Коллекция по умолчанию
Коллекция по умолчанию
Создать новую

A dynamic D pie chart with rotating slices in bright colors, illustrating different data categories. The chart is displayed in a futuristic setting with glowing elements.
Коллекция по умолчанию
Коллекция по умолчанию
Создать новую
A creative infographic with charts, icons, and data visualizations, showcasing a clear and engaging layout on a clean white background.
Коллекция по умолчанию
Коллекция по умолчанию
Создать новую

Number 20 made of white and pink pearls on a light background
Коллекция по умолчанию
Коллекция по умолчанию
Создать новую
Explore a creative financial data visualization featuring currency notes and detailed charts. Ideal for finance, business, or educational projects.
Коллекция по умолчанию
Коллекция по умолчанию
Создать новую

Title: showing title: glossy turquoise 3d twenty percent symbol on soft gradient pink background. resolution use.
Коллекция по умолчанию
Коллекция по умолчанию
Создать новую
Infographic design template with icons, process diagram, vector eps10 illustration
Коллекция по умолчанию
Коллекция по умолчанию
Создать новую
A vibrant pie chart infographic showcasing diverse data segments, ideal for business presentations, data analysis projects, and engagement visualizations.
Коллекция по умолчанию
Коллекция по умолчанию
Создать новую
Modern infographics options banner. Use for workflow layout, diagram, annual report, web design.
Коллекция по умолчанию
Коллекция по умолчанию
Создать новую
Vibrant 3D graphical user interface elements show distinct shapes and colors, ideal for enhancing data visualization or interactive user design projects for any audience.
Коллекция по умолчанию
Коллекция по умолчанию
Создать новую
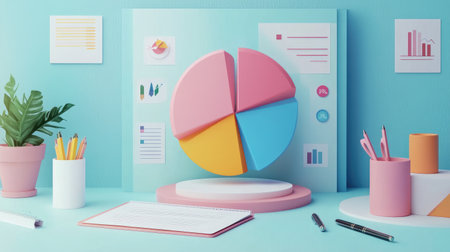
A visually appealing infographic featuring a D pie chart integrated with icons and percentages, placed on a workspace desk with a notepad and pen, capturing the essence of effective data communication.
Коллекция по умолчанию
Коллекция по умолчанию
Создать новую
3D abstract vector illustration of business data graph analysis on white background.
Коллекция по умолчанию
Коллекция по умолчанию
Создать новую

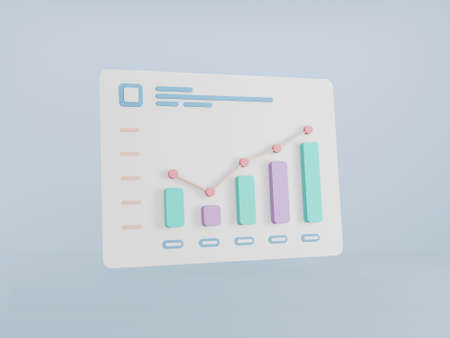
3D financial report with digital elements, representing detailed business analysis.
Коллекция по умолчанию
Коллекция по умолчанию
Создать новую
Growth and development chart of company in new year 2023. Planning,opportunity, challenge and busine
Коллекция по умолчанию
Коллекция по умолчанию
Создать новую
This image features vibrant 3D charts highlighting business data. The combination of bar and pie graphs presents insightful metrics for analysis in reports and presentations.
Коллекция по умолчанию
Коллекция по умолчанию
Создать новую
infographic icon set on white isolated background 3d rendering
Коллекция по умолчанию
Коллекция по умолчанию
Создать новую
An infographic-style image displaying a vibrant 3D bar chart alongside various data points, with arrows and percentages, illustrating the impact of marketing strategies on company growth.
Коллекция по умолчанию
Коллекция по умолчанию
Создать новую
Bright and modern office wall featuring colorful charts and graphs along with a clock. Ideal for business and creative projects that showcase data analysis.
Коллекция по умолчанию
Коллекция по умолчанию
Создать новую
Graphic representation highlights smoking statistics, showing various data points on health risks, demographics, and usage trends in a vibrant layout.
Коллекция по умолчанию
Коллекция по умолчанию
Создать новую

orange realistic glossy 30 percentage number symbol 3d render concept seasonal shopping discount
Коллекция по умолчанию
Коллекция по умолчанию
Создать новую
Explore this vibrant 3D bar graph showcasing data trends with colorful blocks, ideal for presentations, marketing visuals, analytics, and business reports.
Коллекция по умолчанию
Коллекция по умолчанию
Создать новую
Diagrams and charts in isometric format, 3D data analysis columns, infographic modern elements, financial information statistics..
Коллекция по умолчанию
Коллекция по умолчанию
Создать новую

This abstract 3D composition features colorful geometric shapes and charts, symbolizing data analytics and business trends. Ideal for modern presentations.
Коллекция по умолчанию
Коллекция по умолчанию
Создать новую
Vibrant 3D pie chart with colorful segments alongside various data graphs. Perfect for presentations in business, finance, and analytics sectors.
Коллекция по умолчанию
Коллекция по умолчанию
Создать новую
Dark isometric chart. 3d finance presentation layout with graphs charts diagrams and progress bars of volume figures. Vector business analytic graphic set
Коллекция по умолчанию
Коллекция по умолчанию
Создать новую

Top 20 word alphabet letters on red background
Коллекция по умолчанию
Коллекция по умолчанию
Создать новую
A segmented 3D pie chart in shades of blue, orange, and green, floating in front of a business analyst, with arrows and icons showing trends and insights
Коллекция по умолчанию
Коллекция по умолчанию
Создать новую

new year background, 3d rendering text
Коллекция по умолчанию
Коллекция по умолчанию
Создать новую
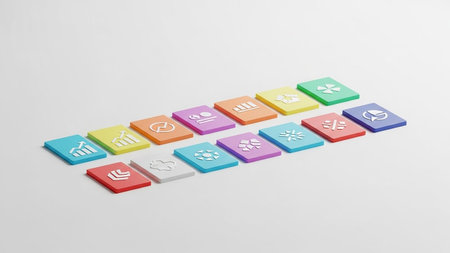
A collection of colorful 3D icon tiles representing various business and finance concepts arranged in rows on a white background.
Коллекция по умолчанию
Коллекция по умолчанию
Создать новую

Modern isometric or 3d location map with colorful living and industrial buildings, city landmarks, streets and place for text or description. Clean infographic design template. Vector illustration
Коллекция по умолчанию
Коллекция по умолчанию
Создать новую

A flat lay of a digital tablet showing a 3D bar graph, with bars popping out of the screen, symbolizing interactive data analysis in a modern business setting
Коллекция по умолчанию
Коллекция по умолчанию
Создать новую
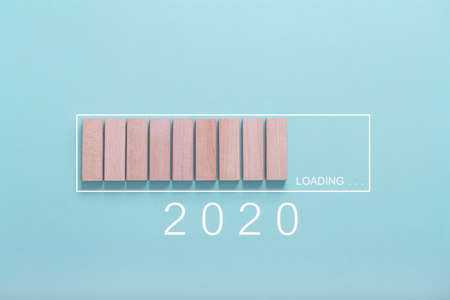
Loading new year 2020 concept , Showing loading bar with wood cube on bluebackground
Коллекция по умолчанию
Коллекция по умолчанию
Создать новую

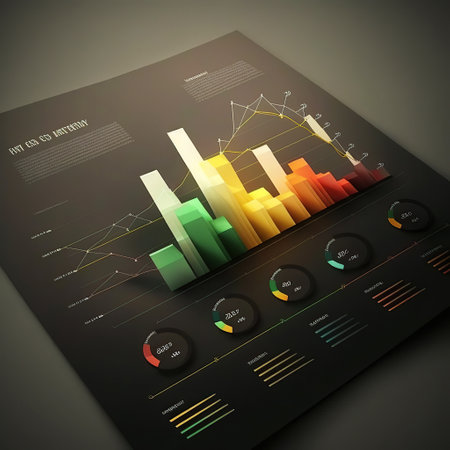
3d illustration of business graph and chart over dark background. Business concept
Коллекция по умолчанию
Коллекция по умолчанию
Создать новую
ai generated Illustration finance report graph bar chart
Коллекция по умолчанию
Коллекция по умолчанию
Создать новую
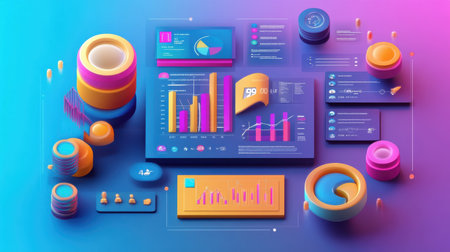
A vibrant digital dashboard features multiple data visualizations, including graphs and charts, designed with colorful elements against a blue and pink gradient backdrop.
Коллекция по умолчанию
Коллекция по умолчанию
Создать новую

3d illustration of colorful application icons in a pyramid on blue background
Коллекция по умолчанию
Коллекция по умолчанию
Создать новую

A business chart of the stock market of the rise and fall of stocks. Stock Market Price Chart.
Коллекция по умолчанию
Коллекция по умолчанию
Создать новую

Colorful tentacles support a rising bar graph, illustrating business growth and success in a corporate-themed scene.
Коллекция по умолчанию
Коллекция по умолчанию
Создать новую
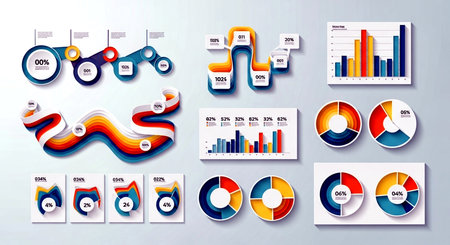
Set of infographics elements for your business design. Vector illustration.
Коллекция по умолчанию
Коллекция по умолчанию
Создать новую
A detailed infographic chart displaying global economic trends with colorful graphs and statistics.
Коллекция по умолчанию
Коллекция по умолчанию
Создать новую
This image features vibrant 3D graphs and charts, including pie and bar graphs, showcasing colorful data representations ideal for business analytics and statistics.
Коллекция по умолчанию
Коллекция по умолчанию
Создать новую
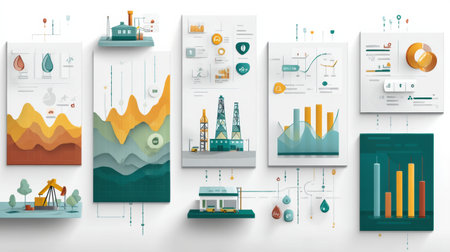
Unique dashboard showcases oil and gas icons in an interactive format, designed for easy navigation and understanding of data for industry professionals.
Коллекция по умолчанию
Коллекция по умолчанию
Создать новую

Top 10 alphabet letters on wooden background
Коллекция по умолчанию
Коллекция по умолчанию
Создать новую

A diagram of a city with a lot of buildings. Generative AI image.
Коллекция по умолчанию
Коллекция по умолчанию
Создать новую

A digital bar graph with sleek, metallic colors, displayed on a black reflective background, with lines and highlights creating depth
Коллекция по умолчанию
Коллекция по умолчанию
Создать новую

A visually striking D bar graph displaying comparative data, with layered bars in different colors, creating a sense of depth and complexity in financial analysis.
Коллекция по умолчанию
Коллекция по умолчанию
Создать новую

charts and graph with mobile phone,smartphone,check,analysis business financial data,time clock isolated on blue background,Online marketing business strategy concept,3d illustration or 3d render
Коллекция по умолчанию
Коллекция по умолчанию
Создать новую
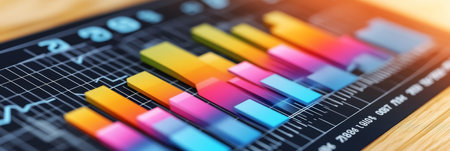
Colorful Financial Charts and Graphs A Bright and Abstract Representation of Market Data
Коллекция по умолчанию
Коллекция по умолчанию
Создать новую
This image features an abstract data visualization showcasing various charts and graphs on a clean, white background. Ideal for presentations and reports.
Коллекция по умолчанию
Коллекция по умолчанию
Создать новую

number twenty with prickles - 3d illustration
Коллекция по умолчанию
Коллекция по умолчанию
Создать новую
Abstract circular web of icons and bubbles
Коллекция по умолчанию
Коллекция по умолчанию
Создать новую
Vector illustration depicting detailed data graph analysis in a business context against a clean white background. Perfect for presentations, reports, and infographics, artwork provides a visually appealing representation of business analytics.
Коллекция по умолчанию
Коллекция по умолчанию
Создать новую
This striking dark themed data visualization features a variety of graphs, charts, and metrics designed for effective business insights and analytics.
Коллекция по умолчанию
Коллекция по умолчанию
Создать новую
A bar chart displaying quarterly revenue growth for a successful business, with colorful bars rising high.
Коллекция по умолчанию
Коллекция по умолчанию
Создать новую
A vibrant 3D illustration showcasing colorful graphs and charts against a stylish purple background, perfect for data analysis, business presentations, and creative projects.
Коллекция по умолчанию
Коллекция по умолчанию
Создать новую
A vibrant 3D financial chart featuring colorful segments and glowing lines, displayed on a digital tablet screen with business executives discussing the results.
Коллекция по умолчанию
Коллекция по умолчанию
Создать новую
Colorful charts and graphs display analytical data on a dark surface, typical of office environments.
Коллекция по умолчанию
Коллекция по умолчанию
Создать новую
Isometric view of various business charts - 3d rendering
Коллекция по умолчанию
Коллекция по умолчанию
Создать новую
A vibrant bar chart displayed on a dark surface, showcasing data analysis and statistical trends, ideal for business presentations and reports.
Коллекция по умолчанию
Коллекция по умолчанию
Создать новую
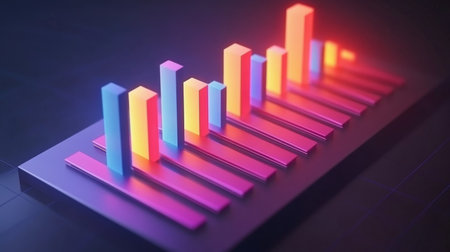
This vibrant 3D bar graph showcases colorful bars in neon hues, ideal for data visualization and analysis in modern business presentations and reports.
Коллекция по умолчанию
Коллекция по умолчанию
Создать новую
Business growth concept. 3d rendering.
Коллекция по умолчанию
Коллекция по умолчанию
Создать новую

Detailed closeup of a pastel-colored drawing depicting an architectural graph by 3D printed buildings, set against a white background
Коллекция по умолчанию
Коллекция по умолчанию
Создать новую
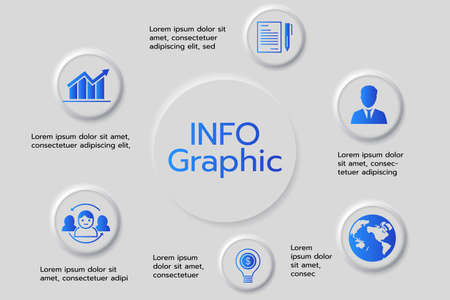
Infographic template for Business, Neumorphism Style.
Коллекция по умолчанию
Коллекция по умолчанию
Создать новую
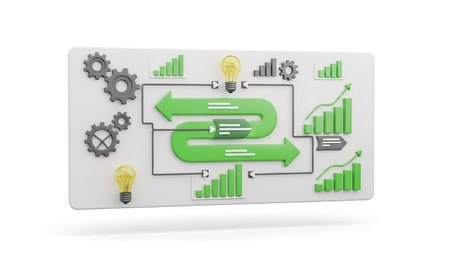
A 3D diagram illustrates a business process with interlocking gears, lightbulbs, arrows, and bar charts on a white background.
Коллекция по умолчанию
Коллекция по умолчанию
Создать новую
Collage of 4 photos. Icons include SWOT analysis, marketing research, data analysis, financial planning. Ideal for presentations, reports and websites in the business field. Modern and elegant design
Коллекция по умолчанию
Коллекция по умолчанию
Создать новую
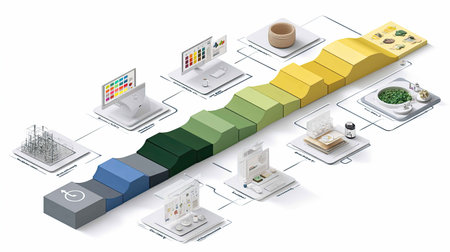
Abstract illustration showing a modern business workflow with colorful steps and various digital elements. Perfect for technology and design projects.
Коллекция по умолчанию
Коллекция по умолчанию
Создать новую
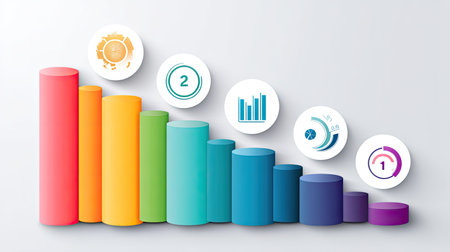
A vibrant bar graph showcasing business data with circular icons, perfect for presentations or reports that highlight growth, trends, and analytical insights.
Коллекция по умолчанию
Коллекция по умолчанию
Создать новую
This vibrant data visualization features various charts and graphs, perfect for business presentations and analysis, showcasing trends and metrics in a modern design.
Коллекция по умолчанию
Коллекция по умолчанию
Создать новую
Business pie chart with 3d colorful bars and charts on white background
Коллекция по умолчанию
Коллекция по умолчанию
Создать новую
isometric infographics timeline presentation element background with business icon 4 steps vector illustration
Коллекция по умолчанию
Коллекция по умолчанию
Создать новую
Various charts and graphs - 3d rendering
Коллекция по умолчанию
Коллекция по умолчанию
Создать новую
This vibrant abstract composition features a variety of geometric shapes and data visuals. Ideal for projects focused on analytics, modern design, and creativity.
Коллекция по умолчанию
Коллекция по умолчанию
Создать новую
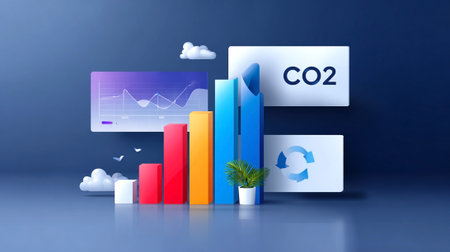
Colorful bar graph illustrates CO2 emissions data alongside a digital screen and recycling symbol, with clouds and a plant in a modern design setting
Коллекция по умолчанию
Коллекция по умолчанию
Создать новую

Digital composite of Wooden cubes with graphs and charts in front of grey background
Коллекция по умолчанию
Коллекция по умолчанию
Создать новую
Big set of infographics elements. Infographics for business presentations or information banner.
Коллекция по умолчанию
Коллекция по умолчанию
Создать новую
Business 3d inforgraphic design set for marketing concept.
Коллекция по умолчанию
Коллекция по умолчанию
Создать новую
This modern abstract data visualization features geometric shapes and colorful elements, ideal for business, technology, or creative projects. Engaging and minimalistic.
Коллекция по умолчанию
Коллекция по умолчанию
Создать новую
Isometric infographics with icons of city and people on blue background
Коллекция по умолчанию
Коллекция по умолчанию
Создать новую

3d man with 2013 numbers on white background
Коллекция по умолчанию
Коллекция по умолчанию
Создать новую
Ring diagram and bar diagram, 3d rendering. Computer digital drawing.
Коллекция по умолчанию
Коллекция по умолчанию
Создать новую
Legion-Media
Создайте свои проекты на основе качественных стоковых фотографий и видео.


Copyright © Legion-Media.